
Get Your Ecommerce Site Ready For The Holidays With Online Monitoring
By Robert Treat, COO, OmniTI
As with brick & mortar stores, the holiday season is a critical time for many ecommerce sites. Like their off-line brethren, these sites also see significant increases in both traffic and revenue. In fact for many companies, holiday ecommerce revenues represents up to 40% of annual sales. If you work for a company that conducts business over the Internet, you have a big responsibility to make sure that your website performs reliably on all types of browsers, mobile devices, etc. with the increased traffic that will come along with the holidays.
Of course these changes in user behavior don't just affect ecommerce sites; consider a social-networking site like Foursquare, a location-based social networking website for mobile devices where users check in at venues using a mobile website. Normally, people might check into a Foursquare venue 3 or 4 times a week, but during the holiday season that frequency might double as they visits more stores and eat out more often while rushing between those stores. On an individual basis that may not sound significant, but if a large percentage of your user base doubles their traffic, you had better hoped you've planned accordingly.
On the technical side, many IT departments will actually change their regular development process in order to handle these changes in user behavior for their ecommerce sites. Starting early in November, many IT teams will stop rolling out new features and halt large projects that might be disruptive to the site or the underlying infrastructure. As the IT department’s focus shifts away from features, most often it turns toward infrastructure and optimization. Adding new monitoring, from improved logging to new metrics and graphs, becomes critical as IT teams seek to have a comprehensive view of site operations so that they can better understand the changes in traffic that are happening, and hopefully be proactive about solving problems before they turn into outages.
Ecommerce companies also focus their attentions on profiling and optimization during the holiday readiness season. Studies continue to show correlations between page load speeds and website responsiveness to increased revenue. Making improvements to these areas is something that can typically be done without having to change the behavior of how things work. IT teams also like to target bug fixes during these times as those corner cases are more likely to show up as traffic increases, especially since many times new users are being added while your existing users are increasing their frequency.
This brings up a good question; if you have an ecommerce site, what should you be monitoring? Most shops generate standard graphs for like disk space or memory usage. This information is good to have, but it only scratches the surface. Your operations staff probably knows all kind of metrics about the system the need to monitor, but how about your application developers? They should know the code that runs your site inside and out, so challenge them to find key metrics in your application stack that are important for their work. For example, how many messages are delivered to the queuing system, or what is the time it takes to process the shipping costs module, or how responsive is a 3rd party API like Facebook or Twitter?
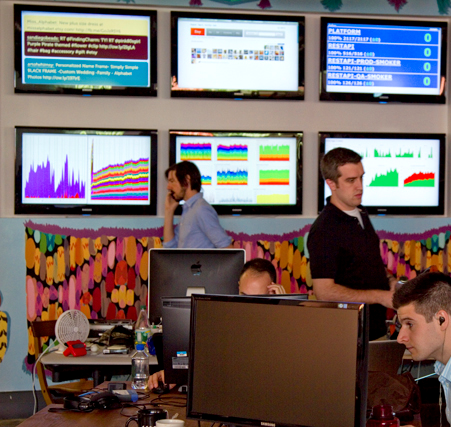
But don't stop there; everyone in your company should be asking themselves "what analytics could I use to make better informed decisions?” For example, do you know if your increased traffic is due to new users or existing users? If you are monitoring new user sign ups, this will start to give you some insight. If you are transacting ecommerce, you should also be tracking revenue related numbers. Those types of monitors are more business focused but they are critical to everyone at your company. So much so that at Etsy, a top 100 website commonly known as "the worlds handmade marketplace", project these types of metricsright out in public.
Ideally once you have this type of information being logged, you can collect the information for analytical reports and historical trending via graphs. It’s important to be able to take the data you are collecting and correlate between metrics. You want to be able to analyze scenarios such as: given the 10% increase in new users this past week; we've seen a 15% spike in web server traffic. If we project those numbers out, can we make it through Black Friday? Cyber Tuesday? Will we make it all the way to New Year’s, or do we need to start provisioning new machines *NOW*? Or what happens if our business model changes and we are required to live through a "Black Friday" event every day?
These are the kind of challenges that a social shopping site faces, with its daily turnover of inventory. You may not need this analytical information real time, but ideally you'll be able to get a mix of real time, near-time (5 minutes aggregated data is common), as well as daily analytical reports. Additionally you should talk with your operations staff about which metrics are mission critical.

While nothing beats preparation, even the best laid plans need good feedback loops to be successful. Measuring, collecting, analyzing, and acting upon data as it comes into your organization is critical in today's online environments. You may not be able to predict the future, but having solid monitoring systems in place will help you to recognize problems before they become critical, and help give you a "snowballs chance" during the holiday season.